When your code breaks, every second counts. In 2026, the complexity of JavaScript—from asynchronous deep-dives to strict-mode constraints—means a "guess and check" strategy just won't cut it. To fix JavaScript errors fast, you need a systematic approac
Before touching your keyboard, follow this 4-step rapid-response cycle:
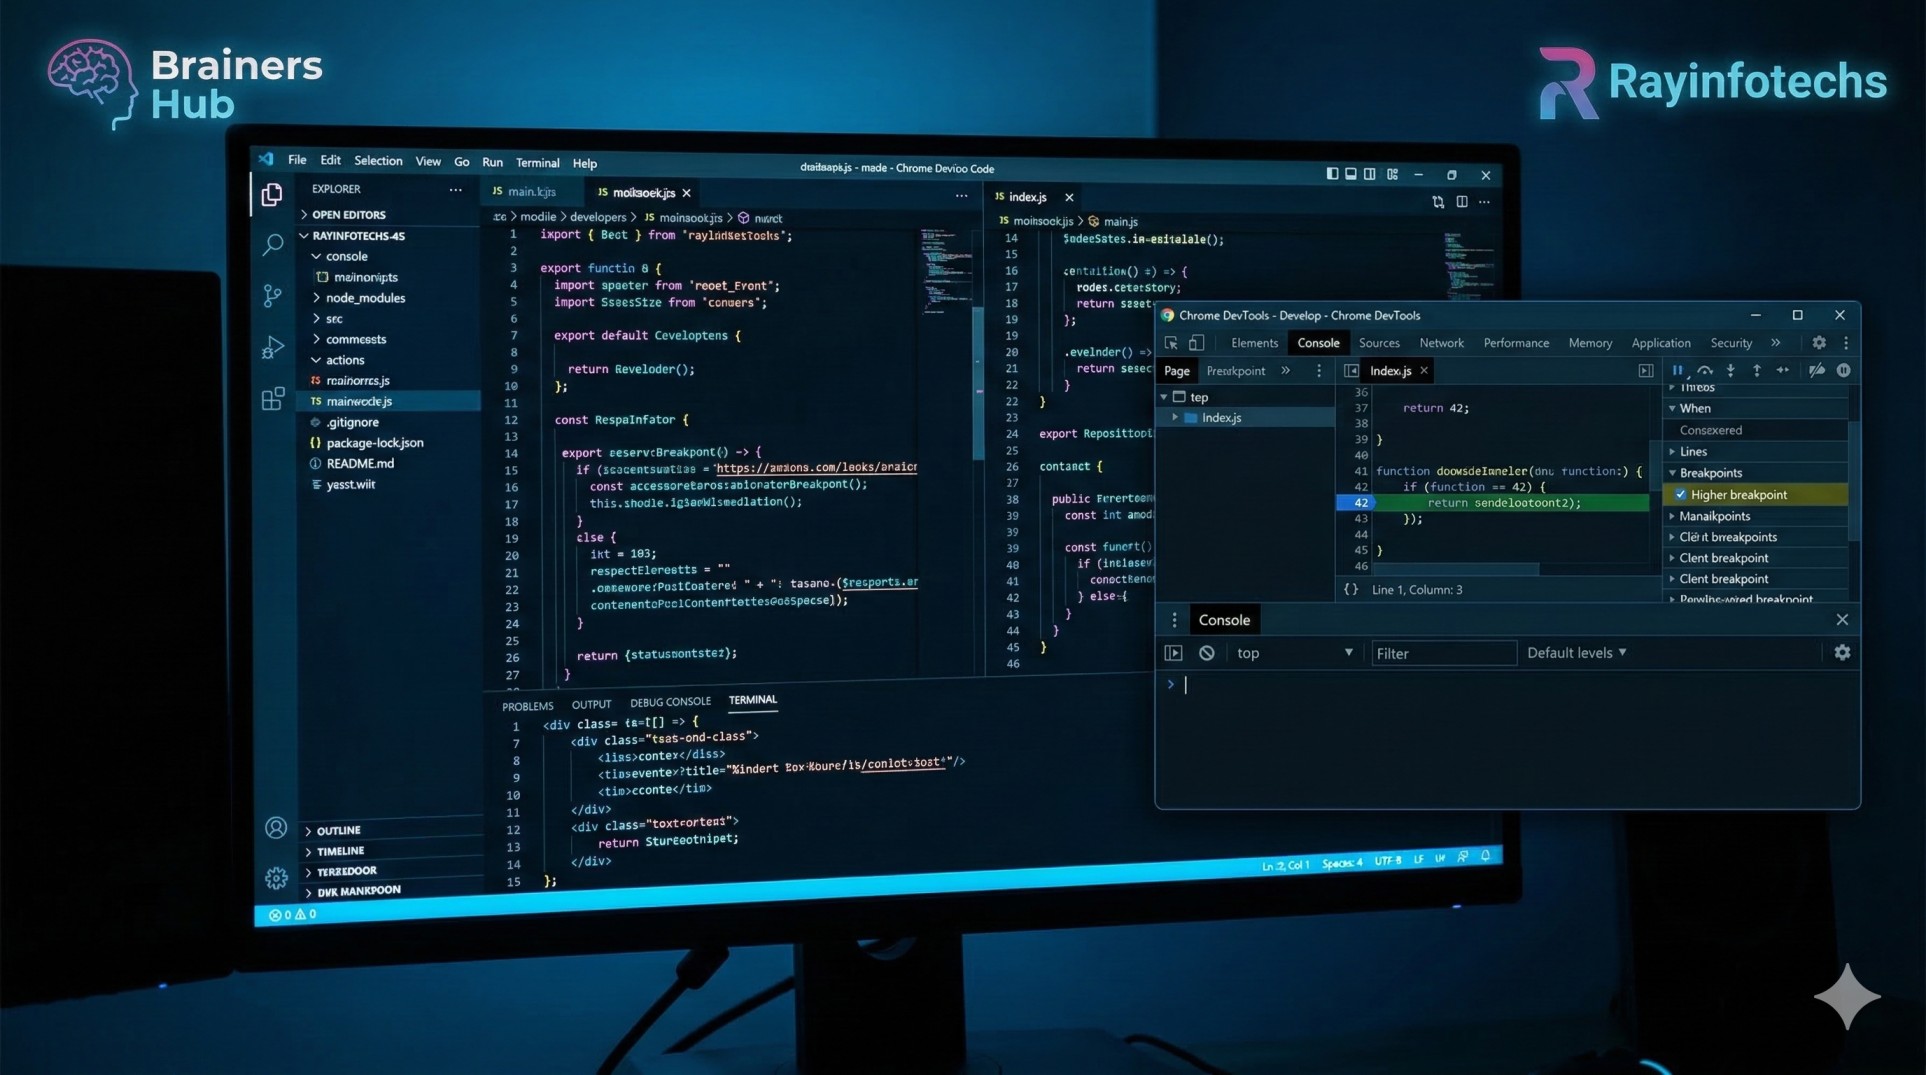
Identify: Open the Console (F12 or Cmd+Opt+I). Read the red text. It tells you the what (Error Type) and the where (Line Number).
Reproduce: Trigger the error again to ensure it's consistent.
Isolate: Use Breakpoints in the Sources tab to pause time right before the crash.
Fix & Verify: Apply the patch and confirm the console stays clean.
Most JavaScript bugs fall into three categories. Here is how to kill them on sight:
The Symptom: Uncaught SyntaxError: Unexpected token...
The Fast Fix: Use a Linter like ESLint. It highlights mismatched brackets {} or missing parentheses () in real-time within your editor, catching errors before you even hit "Save."
The Symptom: Uncaught ReferenceError: x is not defined
The Fast Fix: Check your scopes. Ensure the variable is declared (using let or const) and that you aren't trying to access a function-scoped variable from the global scope.
Pro Tip: Enable
"use strict";at the top of your files to prevent accidental global variables.
The Symptom: Uncaught TypeError: Cannot read property 'x' of undefined
The Fast Fix: Use Optional Chaining (?.). Instead of user.profile.name, use user?.profile?.name. This prevents the script from crashing if user or profile is missing.
Browser tools have evolved. Use these advanced features to debug 2x faster:
Conditional Breakpoints: Don't pause on every loop iteration. Right-click a line number, select Add conditional breakpoint, and enter a condition like i === 50. The debugger will only trigger when that's true.
The "Watch" Pane: Instead of typing console.log(variable) fifty times, add that variable to the Watch pane in the Sources tab. It will auto-update its value as you step through the code.
Logpoints: Want to log data without changing your source code? Right-click a line number and select Add logpoint. This injects a virtual console.log into the execution stream without cluttering your actual .js files.

 Live Test


.png)